
Abstract
Through a comprehensive 4-year study of private sector North American partnerships, John Gottula shares insight into prominent innovation and growth areas for 2022. The information and hypotheses presented supports prudent business planning including portfolio and technology positioning.
Major findings
- 230 ± 79 AgTech and Foodtech partnerships will be announced in 2022 – appreciably more than past years. However, increasing price and revenue growth within the sector exert downward force on the trend.
- The most (42 ± 14) partnerships will be in food, feed and fiber, an increase of a third from average of past 4 years. This is in part driven by inflationary pressures and consumer discretionary spending.
- Software and crop inputs partnerships will enjoy good growth (to 25-50/year each), building on current momentum. Internet of Things (IoT)/machinery partnerships that go beyond interoperability will remain important and continue to grow (20-40/year).
- At about 10-20 partnerships per year, activity related to agricultural production and sustainability will remain stable while genetics will slightly decline. The stasis of the sustainability landscape may relate to its insularity and the decline in genetics partnerships may represent a lasting effect of industry consolidation.
- Number of partnerships and partner choice determines a company’s ecosystem centrality.
- Stronger partnerships (denoted by the term ‘alliance’) are associated with terms connoting certain outcomes and straightforward goals.
Impetus and methods
AgTech and FoodTech experienced disruption in 2020 and 2021 through extensive venture investment on the heels of massive consolidation. Streams of private sector funding now more than make up for stagnating public sector investments (Burwood-Taylor, 2021; USDA-ERS, 2019). And the shakeup goes beyond funding: Through successful startup incubators and accelerator partnerships, startups are achieving synergistic growth opportunities (Hammerich, 2018; Kendall, 2021). Likewise innovation uptake within the blue-chip agriculture companies often comes through venture investment arms (e.g. Syngenta Ventures) or robust alliances programs (e.g. BASF Open Innovation Platform). Partnerships facilitate innovation and technology licensing, open new distribution networks, and support reciprocal commercial endeavors.
With partnerships increasing in popularity, the theme of the American Society of Agricultural and Biological Engineering NC Chapter 2021 annual meeting was “Partnerships.” It was in this venue I originally shared this study as its keynote speech.

The goal of the study was to determine the state of AgTech and FoodTech partnerships and gain insights through a rich analytics framework. I comprehensively mapped the network of interacting private sector AgTech and FoodTech communities and pinpointed opportunities for different industry actors to plug in. I identified areas of growing importance and unpacked potential causal factors. And I modeled how partnership-marketing press release language can be honed to optimize product positioning or recognize the strength of the relationships behind the announcements.
Scope
The AgTech and FoodTech partnership study was a systematic investigation of agricultural partnership media coverage. The criteria for study inclusion were:
- The partnership was announced 2018-2021 between two private sector companies and was covered in at least one independent media outlet.
- The announced or implicit partnership scope was to have significant presence or impact to North America and relevant on a regional, national, or international basis.
- At least one partnering company must “touch” raw agricultural products and the partnership must advance an economic goal (i.e. not be limited to philanthropy or charity).
- The basis of the partnership is not membership or subscription, and not limited to an API or interoperability.
To my knowledge this work is the most comprehensive study of private sector AgTech and FoodTech partnerships ever published.
Data engineering
The study was done between September and October 2021, covering a period of January 2018 to September 2021. Two hundred sixty-six web searches were logged with 352 partnerships matching the criteria were identified. The partnerships were categorized according to subject, agriculture sub-vertical, phase (e.g. commercial, innovation, distribution, etc.), and by connection name (partnership, collaboration, alliance, etc.). A summary of sub-verticals and subjects are summarized (Appendix 1).
Analytics
Data analytics were performed in SAS Viya® Visual Analytics. The results of network science, forecasting, natural language processing and machine learning algorithms are presented. Forecast model outputs were evaluated at 90% confidence intervals.
Trends
The frequency of partnership announcements is increasing AgTech partnerships grew at a 49% compound annual growth rate between 2018 and 2021. The largest and fastest growing partnership phase was commercial (43.8%) followed by innovation-type partnerships (31%). Service (e.g. IT support), finance or insurance, or distribution-type partnerships were less frequent (combined 25.3%) (Fig 2).

Partnerships showed a consistent quarterly uptrend without a discernable seasonal component. The major uptrend was broken in Q2 2020, followed by a quick rebound by Q3 2020 supporting strong and steady growth throughout the rest of 2020 into 2021 (Fig 3).

Except for a marked uptick in sustainability partnerships in 2020, partnership growth among sectors remained comparable throughout the period studied.
Partnership subjects
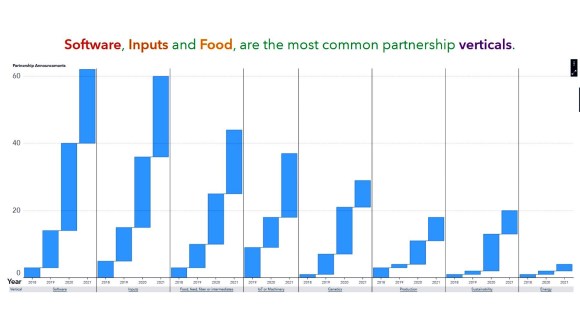
The most common partnerships identified were about 1) software, 2) crop inputs and 3) food, fiber and intermediates (Fig 4, Appendix 1). There were 62 software partnerships and 60 inputs partnerships. Software partnerships primarily cover precision enablement, data science, satellite imagery, or cloud/connectivity. Crop inputs include crop protection (including biological crop protection) and fertilizer/biostimulants. The third most common topic was food, fiber and intermediates, which encompasses processed food or drinks, meat substitutes and bioreactors/chemical intermediates.
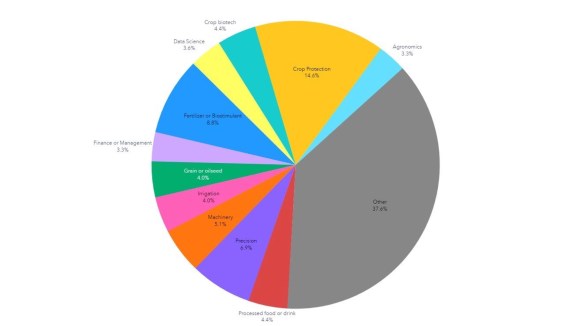
Secondary partnership areas include crop biotech, grain or oilseeds, data science, finance or management, and agronomics. Highly diverse and individually less frequent ‘other’ subjects (Fig 5) round out the roster: breeding, crop insurance, drones, carbon, meat substitutes, renewables/emissions, crop warranty, feed, flavorings/additives, bioprocess, livestock, logistics/traceability, food access/utilization, packaging, seed, weather, fiber, indoor farming and a lone partnership supporting fresh produce.
Drivers of change
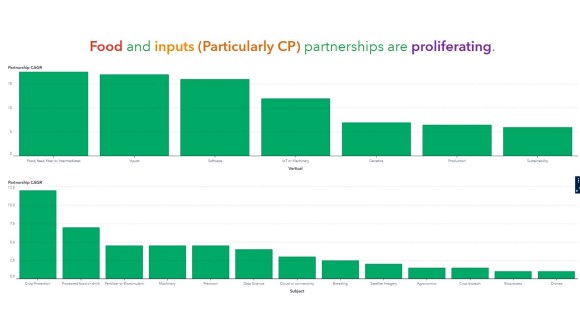
The fastest growing partnerships are the top 3 most common in reverse order: food-related partnerships (17.5% CAGR), inputs (17%) and software (16%) (Fig 6). Within these areas, there are notably high growth rates for crop protection (12%) and processed foods or drinks (7%). If these trends continue, we expect crop inputs and software development-related activity to remain prominent, while processed food and other FoodTech activity to surge.
To explore time series dynamics, AgTech and FoodTech partnership counts were fit to an autoregressive moving average (ARIMA) time series forecasting model. There was a significant time-series autocorrelation between monthly partnerships announced and crop producer price index (“Crop input prices” from the USDA National Agricultural Statistics Service) for the study period (Fig 7).

The forecast [based on an ARIMA(3,1,1) model] revealed three things about partnership trajectory for 2022:
- The trend of more partnerships will continue into 2022
- Higher producer price index is negatively correlated to partnerships. For every 1% decrease in producer prices, there are on average 5.6 more partnerships. I.E. lower prices or sector revenue, more partnerships.
- The lag between a change in producer price index and partnerships is three months. I.E. lower prices or sector revenue, more partnerships next quarter.
2022 partnership expectations
High and continued rising input costs (American Farm Bureau, 2021) will exert downward pressure on the freight train increase of partnership activity. New partnership announcements are likely to grow at one marginal addition per month. In total, the forecast indicates there will be 230 partnerships (±79) in 2022. This compares favorably to 169 partnerships logged between January and September 2021 and expected to be well over double the 104 in 2020.
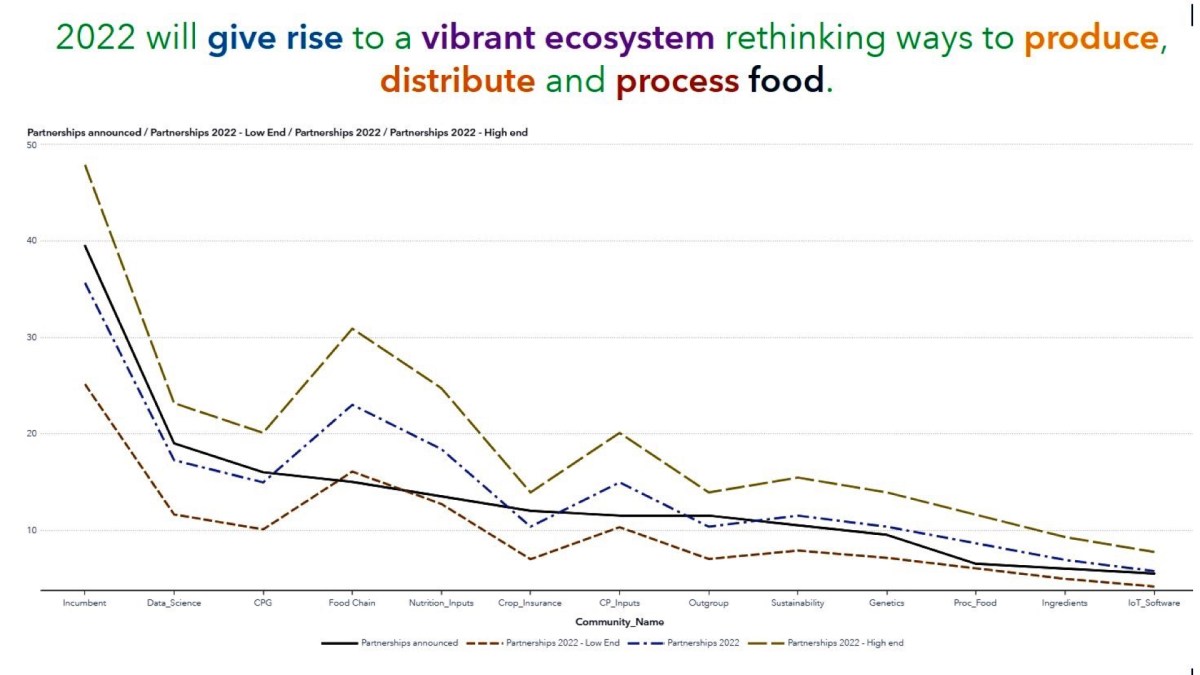
The model forecasts a rapid expansion (an increase of a third from the 2018-2021 average) of partnerships related to food (42 ± 14) (Fig 8).
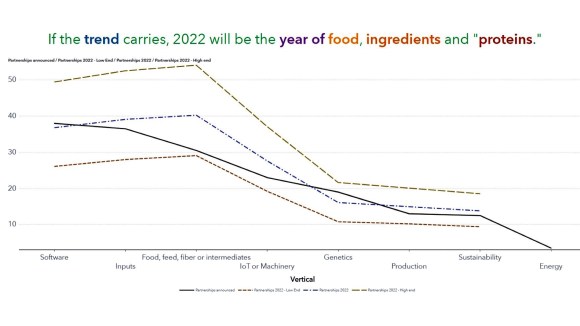
Steady partnership growth will apply across most other sub-verticals. The only vertical where deceleration is more likely than not is genetics including biotech. The reduction in external private sector partnerships in genetics potentially reflects industry consolidation.
Sector landscape
Visualizing companies as nodes and partnership announcements as edges (connectors), a highly cohesive network emerges (Fig 9).

Twelve communities within the network were identified. These communities and their centroids are described in Table 1. Centroids are nodes with the highest “closeness centrality,” which is the condition of being innermost; community focus indicates the main partnership topics within those communities.
Table 1: Community names, centroids and descriptions. CP = Crop Protection; CPG = Consumer Packaged Goods.
| Community name | Centroid 1 | Centroid 2 | Community-wide focus |
|---|---|---|---|
| CP Inputs | Corteva | FMC | Innovating CP inputs (also other aspects of crop production/marketing) |
| CPG | Microsoft | SAS Institute | Food marketing; cloud/connectivity (also logistics & sustainability) |
| Crop Insurance | Growers Edge | CNH Industrial | Crop insurance, machinery (also precision, data science, finance) |
| Data Science | CropX | Solinftec | Satellite imagery, crop warranty, data science and precision |
| Food Chain | Novozymes | Cargill | Livestock, renewables, intermediates, indoor farming, processed food |
| Genetics | NRGene | DJI | Breeding, crop protection, drones |
| Incumbent | BASF | AGCO | Diversified with commercial emphasis on crop inputs and Precision/IoT |
| Ingredients | Gingko BioWorks | (None) | Innovating flavorings, additives and ingredients |
| IoT Software | Pessl | AWS, Deere | Commercial community focused on CP, precision ag and data |
| Nutrition Inputs | Evogene | Bayer | R&D for fertilizer, biotech and CP |
| Processed Foods | PepsiCo | (None) | Creating and going to market with new food and drinks |
| Sustainability | None – decentralized and peripheral | None – decentralized and peripheral | Sustainability commercial services |
In addition to the twelve interconnected communities, there was a community of ‘outgroups,’ companies with one or more partnerships not connected to the larger network. The outgroups were mostly focused agrochemical and vertically integrated consumer package goods companies.
Comparing flagship companies within each community (Table 1) evokes synergism (e.g., cloud + analytics, ethanol + grain, inputs + machinery, gene discovery + seed channel marketing, etc.). Partnering across market segments creates network recursion – connectors stretch outward toward disparate sub-verticals. For example, a company whose core is seeds and agrochemical inputs may partner simultaneously with a carbon offset market firm, a digital agronomy app provider, a grain processor, a logistics provider and a biostimulant discovery firm.
Gaining ecosystem centrality
There is a growing corporate focus on data and ecosystem integration (Geene, 2020). How does a company gain community centrality? Connection number seems important but not sufficient: having many partnerships do not guarantee a move away from the periphery (Fig 10). All else equal, more external partnerships (about 1 per year, on average) does seem to be a good predictor of ecosystem centrality within the AgTech and FoodTech landscape. It is plausible the same is true for acquisitions.

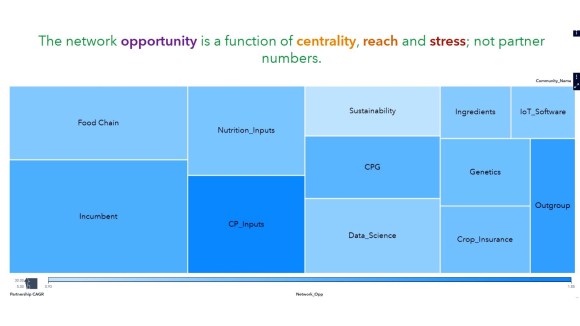
Looking deeper than partnership numbers, partnership requirements tend to be highly specific. Companies design partnerships to solve specific challenges like opening a new client base, augmenting a discovery platform, or to provide a critical software functionality that make business tasks run smoothly. Partnership choices should reflect a company’s networking opportunity, which is a function interconnectedness (closeness centrality), reach (how many introductions can be made) and stress (an indicator of novelty). The mean networking opportunity (shade of blue) within each community does not relate to the partnership growth rate (box size) within that community (Fig 11). This means companies are better off to choose collaborators based on the network effect, and not bandwagon leaders.
Pathway analysis can inform community or partner choice. Companies seeking to grow client base through partnership should channel their offerings through the right community path to achieve the largest impact (Fig 12).

Here are some examples of how to operationalize pathway analysis concepts:
- Private sector sustainability offerings will achieve the highest network effect when paired with the Crop Protection Input community or community outgroups, or secondarily, the Processed Food community.
- Additional partnerships of sustainability offerings within the sustainability community are not predicted to maximize their network effect or socioeconomic impact.
- Groups working in food, feed, fiber or intermediate would generate the largest overall impact working with companies in the Consumer Packaged Goods (CPG) community.
These results make sense considering how the agricultural economy fits together, e.g. sustainability practices are strongest when linked to economic drivers, and that there are strong incentives to connect supply chains to drive efficiency.
Positioning partnerships
Partnership announcements may promote the originator’s company, help position offerings or extend goodwill to the partnering firm. Partnership press releases take the following format:
“Date, City(ies), [Company 1], ‘a leader in X’ and [Company 2], ‘a leader in Y,’ are announcing a [connection name, i.e. partnership, collaboration, joint venture or alliance] to [verb] [object of the partnership].”
Aggregating and parsing partnership announcement media coverage reveals industry priorities and hints at the quality of individual partnerships.
Press releases most often name the connection type “partnership.” In a scientific spirit, innovation-related subjects more often get the label “collaboration” (Fig 13a). “Alliance,” which connotes a very special bond, is extremely rare (2.56%). Deconstructing the press release object into two-word topics (Fig 13b) facilitates parametrization of partnership topics and model attributes of the partnership, such as the connection name (Fig 13c). More broadly, these techniques show how ‘natural language processing’ (NLP) and machine learning can be integrated to inform business analytics.

Different combinations of discrete two-word topics generate different propensity scores for the connection to be named ‘alliance’ (Fig 14).
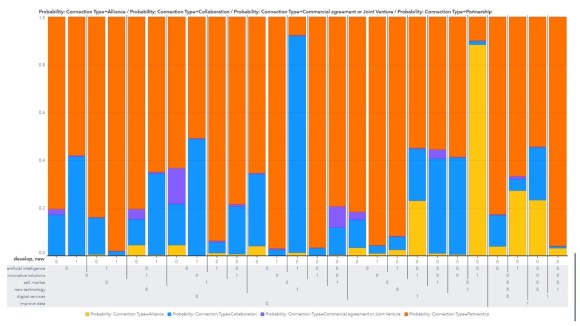
These include:
- The keyword combinations positively associated with ‘alliance’ are: “digital” and “services,” “innovative” and “solutions,” and “new” and “technology.”
- The topics that overall make the label ‘alliance’ less likely are: “sell” and “market,” “develop” and “new,” and “improve” and “data.”
- The propensity of “Artificial Intelligence” to be associated with ‘alliance’ is conditional on including “improve” and “data,” while avoiding the other topics in the above bullets and in Fig 16. In other words, there is a conditionality of AI on data and an importance to demonstrate how AI improves outcomes. Those word combinations associated with ‘alliance’ suggests sincerity or straightforwardness potentially absent from combining “AI” with “new technology.”
The textual analysis of partnership announcements reveals that ‘alliances’ partnerships most often stem from high-tech novel finished goods or services delivered outside of a commercial context. It also suggests that more straightforward the partnership headlines signal a higher degree of certainty or conviction between parties.
Concepts and hypotheses
The AgTech and FoodTech partnership study presents an analytical synthesis of independent media coverage. Accordingly, please do not use it as a basis for investment or any other commercial decisions. However, it may be helpful for companies seeking faster-than-market upside to consider the following testable hypotheses in 2022.
Hypothesis 1: Partnerships will not be necessary for those undergoing satisfactory growth. The forecasting model showed a negative relationship between producer price index and partnerships. The higher prices crop producers pay for inputs (machinery, seeds, agrochemicals, etc.), the more revenue flows into companies providing those goods. Companies or departments facing less than adequate financials or innovation metrics will prioritize partnerships as simple and fast problem fixes. The three-month (quarterly) lag to the effect bolsters the distress-then-partnership concept. Perhaps this is why management literature about partnerships focuses on companies losing market share, clients or status (Gnanasambandam and Uhl, 2017; Kanter, 1994).
Hypothesis 2: Companies with high agricultural raw material costs will innovate rapidly in 2022, and their biggest gains will be in partnership with companies in the Food Value Chain community. High grain prices and supported futures spell trouble for feed mills, ethanol plants, exporters and everyone else in the middle of the value chain. Extreme inflationary pressures for grain millers’ producer price index relative to consumer food (Fig 15) demonstrate the squeeze that processors face.

This squeeze will spur more partnerships especially of companies within Food Value Chain community (Fig 16).

Rational objectives would include reducing raw material costs, making plant and personnel more efficient and marketing value-add downstream products. Network analysis points firms within Food Value Chain to affiliate with the CPG community, which address the efficiency and value-add pillars.
Hypothesis 3: Partner choice and discerning press release language will distinguish companies armed with strategic clarity from those following opportunity. Partnership objective statements contain subtle cues about the focus and effectiveness of the partnership. Is the partnership objective a rough sketch or a done deal? Is it about a finished technology or a hope? Is there something commercial teams can sell, or not? There are some companies on the periphery that have many partnerships. These companies may be building a new ecosystem or may just prioritize gaining on external visibility without much regard to context. Others, those who have a clear focus and can demonstrate results, are the ones who will achieve ecosystem centrality through discerning partner choices.
Hypothesis 4: The most successful sustainability partnerships will be creative, while effective crop protection partnerships will be predictable. In 2020 and 2021, a surge in private sector sustainability partnerships largely took place within an insular community. The partnership forecast for that sector indicated stagnant growth, which suggests the community’s relative isolation may be detrimental. Creative sustainability partnerships that reach out to crop protection, genetics, CPG and especially food value chain companies will grow the scale of the ecosystem (and potential impact) enormously. While companies supporting crop protection also show a relatively tight cohesion, the networking opportunity for crop protection products suggests more partnerships will come within the crop protection community. Drivers of these engagements include quests for new modes of action, biological substitutes and product or distribution synergism.
Hypothesis 5: Companies can gain additional layers of value by building partnerships outside the private sector, or secretly. Criteria that bound this analysis channeled its conclusions, and only materials that were private sector and public facing were included. What activity is going on outside of the private sector and is that important? The public cares much more about renewable energy, climate change and social issues than would be revealed by studying for-profit private sector objectives. Nonprofit and government entities are making inroads in these areas of high public visibility, including through public-private partnerships. Furthermore, the public-facing criterion for inclusion in the study downplays less popularly admired topics like food safety, cybersecurity, and customer analytics, which roar behind the scenes of feelgood press coverage.
Parting thought
The agriculture industry is comprised of some of the finest people. Even though agricultural research and commercial personnel probably skew urban, the vocation still comes with a folksy, handshake, collaborative ethos that other industries could barely imagine. The culture of the industry lends itself to partnerships. It’s a spirit that gives us staying power, an air of nobility and a sense of esprit de corps:
“Your corn is ripe today; mine will be so tomorrow. ‘Tis profitable for us both, that I should labour with you today, and that you should aid me tomorrow.” – David Hume
©John Gottula, December 2021
Bio

Dr. John Gottula is an AgTech innovator with an applied crop science background and a passion for analytics. John is the co-creator of #AgileAg, a movement to link Agile processes with crop science to drive analytics adoption in the agriculture sector. Join the conversation with John on LinkedIn.
Appendix 1: Counts of partnership verticals and subjects sampled 2018-2021
| Subjects and Verticals | Energy | Food, feed, fiber or intermediates | Genetics | Inputs | IoT or Machinery | Production | Software | Sustainability | Subject total |
|---|---|---|---|---|---|---|---|---|---|
| Agronomics | 1 | 1 | 3 | 6 | 11 | ||||
| Bioprocess | 1 | 5 | 6 | ||||||
| Breeding | 13 | 13 | |||||||
| Carbon | 9 | 9 | |||||||
| Cloud or connectivity | 10 | 10 | |||||||
| Crop biotech | 13 | 13 | |||||||
| Crop Insurance | 11 | 11 | |||||||
| Crop Protection | 40 | 1 | 2 | 5 | 48 | ||||
| Crop Warranty | 5 | 5 | |||||||
| Data Science | 1 | 1 | 13 | 15 | |||||
| Drones | 4 | 6 | 10 | ||||||
| Feed | 3 | 2 | 1 | 6 | |||||
| Fertilizer/ Biostimulant | 26 | 26 | |||||||
| Fiber | 3 | 3 | |||||||
| Finance or Management | 1 | 2 | 7 | 10 | |||||
| Flavorings or Additives | 6 | 6 | |||||||
| Food access/ utilization | 2 | 1 | 3 | ||||||
| Grain or oilseed | 8 | 3 | 2 | 13 | |||||
| Indoor farming | 4 | 4 | |||||||
| Intermediates | 7 | 7 | |||||||
| Irrigation | 9 | 2 | 11 | ||||||
| Livestock | 1 | 1 | 2 | 1 | 2 | 7 | |||
| Logistics or Traceability | 2 | 1 | 1 | 2 | 6 | ||||
| Machinery | 17 | 1 | 18 | ||||||
| Meat Substitute | 8 | 8 | |||||||
| Packaging | 3 | 3 | |||||||
| Precision | 7 | 15 | 22 | ||||||
| Processed food or drink | 19 | 1 | 20 | ||||||
| Produce | 1 | 1 | |||||||
| Renewables/ Emissions | 7 | 2 | 9 | ||||||
| Satellite Imagery | 10 | 10 | |||||||
| Seed | 4 | 1 | 5 | ||||||
| Weather | 1 | 2 | 3 | ||||||
| Vertical total | 7 | 61 | 38 | 73 | 46 | 26 | 76 | 25 | 352 |
